Marin ferries
Three terminals connecting Marin to the city.
Distinct towns, open spaces, and a different daily rhythm.
Marin is a region of distinct towns and residential areas. Compare Mill Valley, the ferry towns, and places such as Upper Lucas Valley through the home, land, and daily route.

A deeper
sense of home.

Three terminals connecting Marin to the city.

Grassland trails and rocky open slopes.

A café stop in Larkspur.
Mill Valley’s housing inventory includes single-family homes and multi-unit buildings. Upper Lucas Valley offers a different architectural reference: a mid-century development with Eichler and American Housing Guild homes. A county-wide search should separate these housing types before comparing land, layout, and shared obligations.
Compare the route into town with the Shoreline Highway side of the search. A Mill Valley mailing address does not by itself establish city jurisdiction.
The ferry-terminal area and the Magnolia corridor offer different reference points. Compare the actual journey between home, daily stops, and the boat.
For a mid-century house, compare the original design with alterations and the neighborhood’s architectural-review process. The homeowners association provides the governing documents.
Golden Gate Ferry serves these Marin terminals. Compare the full journey, including the trip from home to the boat and onward to your destination.
Current ferry routes & schedulesOne example of Marin’s open space, with trails across grassland and rocky slopes. Check the preserve map for the entrance and route you would use.
Explore Ring MountainRustic Bakery has cafés at Marin Country Mart, 2017 Larkspur Landing Circle, and 1139 Magnolia Avenue. Visit the location closest to the homes you are comparing.
Rustic Bakery cafés2020–2024 American Community Survey
Countywide context. Individual Marin towns and neighborhoods can differ substantially from these county averages.
Estimates with approximate 90% margins of error shown below.
103,018
Occupied housing units, equivalent to households.
±725
65%
Share of occupied housing units that are owner-occupied; the remainder are renter-occupied.
±1.0 percentage points
71%
Share of all housing units in one-unit detached or attached structures. This describes the building, not its legal ownership form.
±1.1 percentage points
8%
Share of workers age 16 and over whose usual commute was by public transit, walking or bicycle. The denominator includes people working from home and excludes people who were not workers.
±0.7 percentage points
Five-year survey estimates, not a current headcount or a measure of homes for sale. Figures describe the geography named above. Margins shown are approximate 90% margins of error; small differences may not be meaningful.
San Francisco figures combine Census tracts assigned to the named city analysis areas. Marin uses the published county totals. Table links show the underlying geographies.
These estimates describe an area, not the people in a particular building or what a home is worth. They are not live market figures.
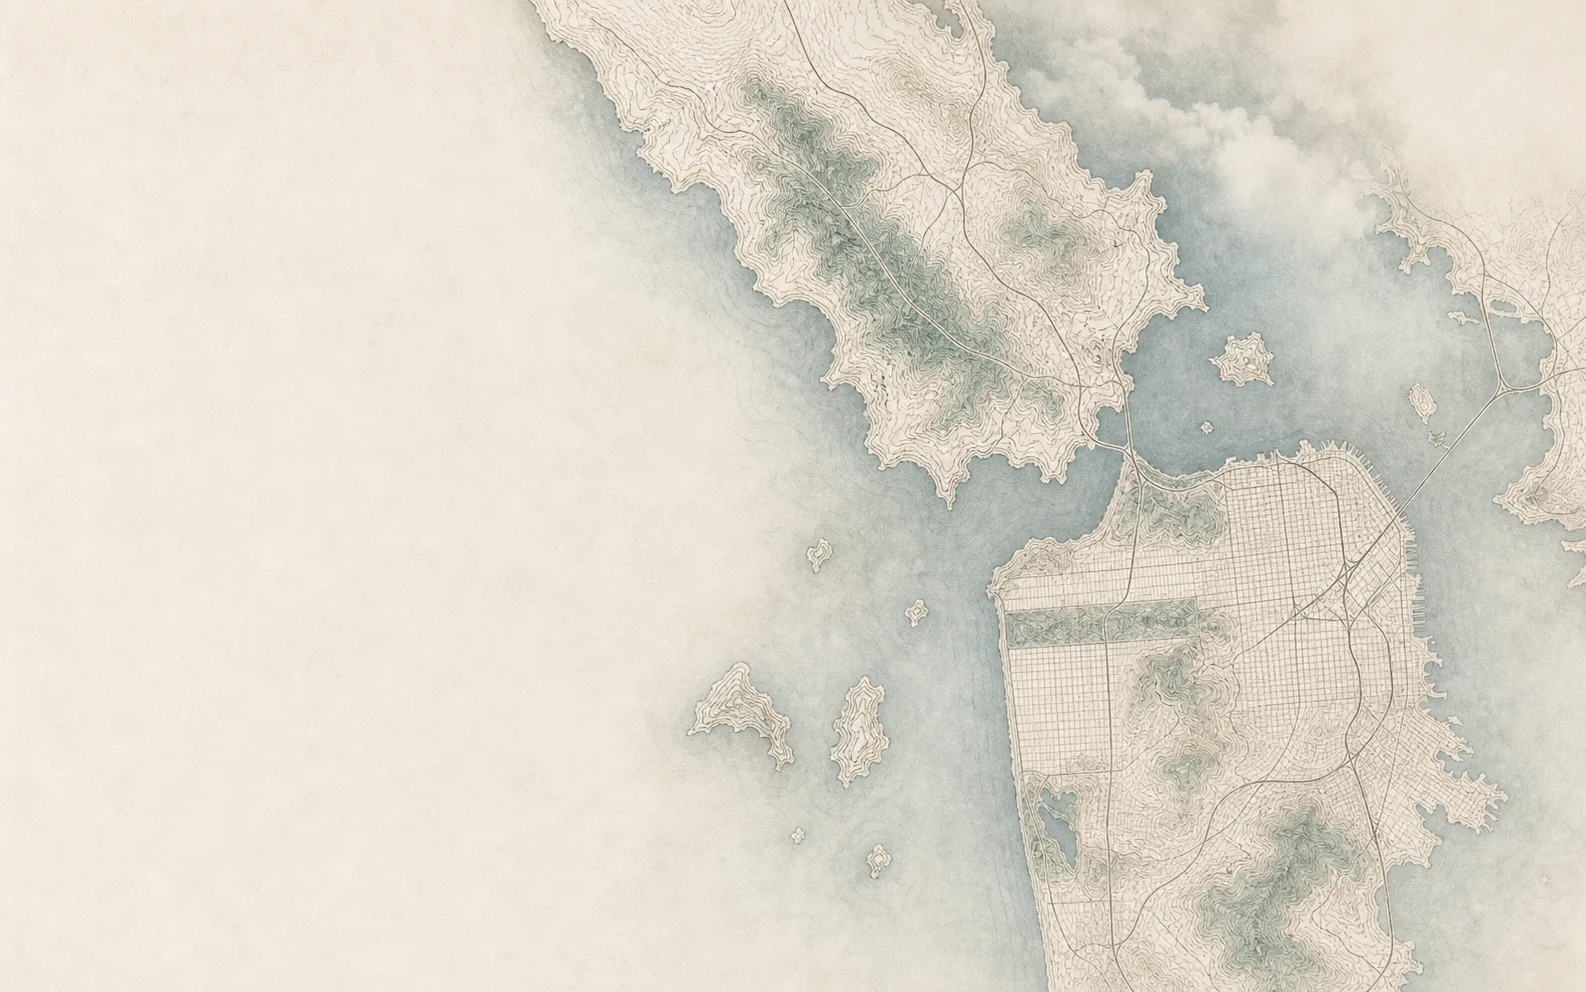
Maps are generated artistic illustrations informed by public geographic data, for general orientation rather than survey-accurate boundaries. Use the street-map link for location details. Sources: City of San Francisco, Marin County, U.S. Census Bureau and © OpenStreetMap contributors.
A closer look
A mailing label is a starting point, not a substitute for confirming the property’s jurisdiction. Use the county’s mapping resources and the relevant city or county planning office before relying on a rule for an alteration or future project.
Compare the whole journey at the times you need to travel. For a ferry trip, include getting to the terminal, waiting or transferring, the crossing, and the destination end. Check current schedules rather than relying on a fixed commute estimate.
It describes physical conditions associated with fire hazard, rather than the full risk or condition of an individual home. Review property-specific information and mitigation separately, and obtain an actual insurance quote; a map is not a coverage decision.
Compare usable outdoor space, slope, drainage, access, and recorded limitations, not just acreage. ReadyMarin links to the county’s Natural Hazards Map as a starting point for flood information; follow up with the property disclosures and appropriate professional review.
Available homes
Live residential inventory across Marin County.
Loading homes
Loading Marin County listings.
You can also open home search while the listings load.
Listing information is provided by the applicable multiple listing service and is deemed reliable but not guaranteed. Availability and property details may change without notice.
Send Nader an address or a few priorities. Start with a conversation about what matters to you.